Generate Random Points in Circle
I came across an intereting problem of generating random uniform points in a circle of radius R. I initially came up with two methods, one there you sample x ~ U(-R,R)
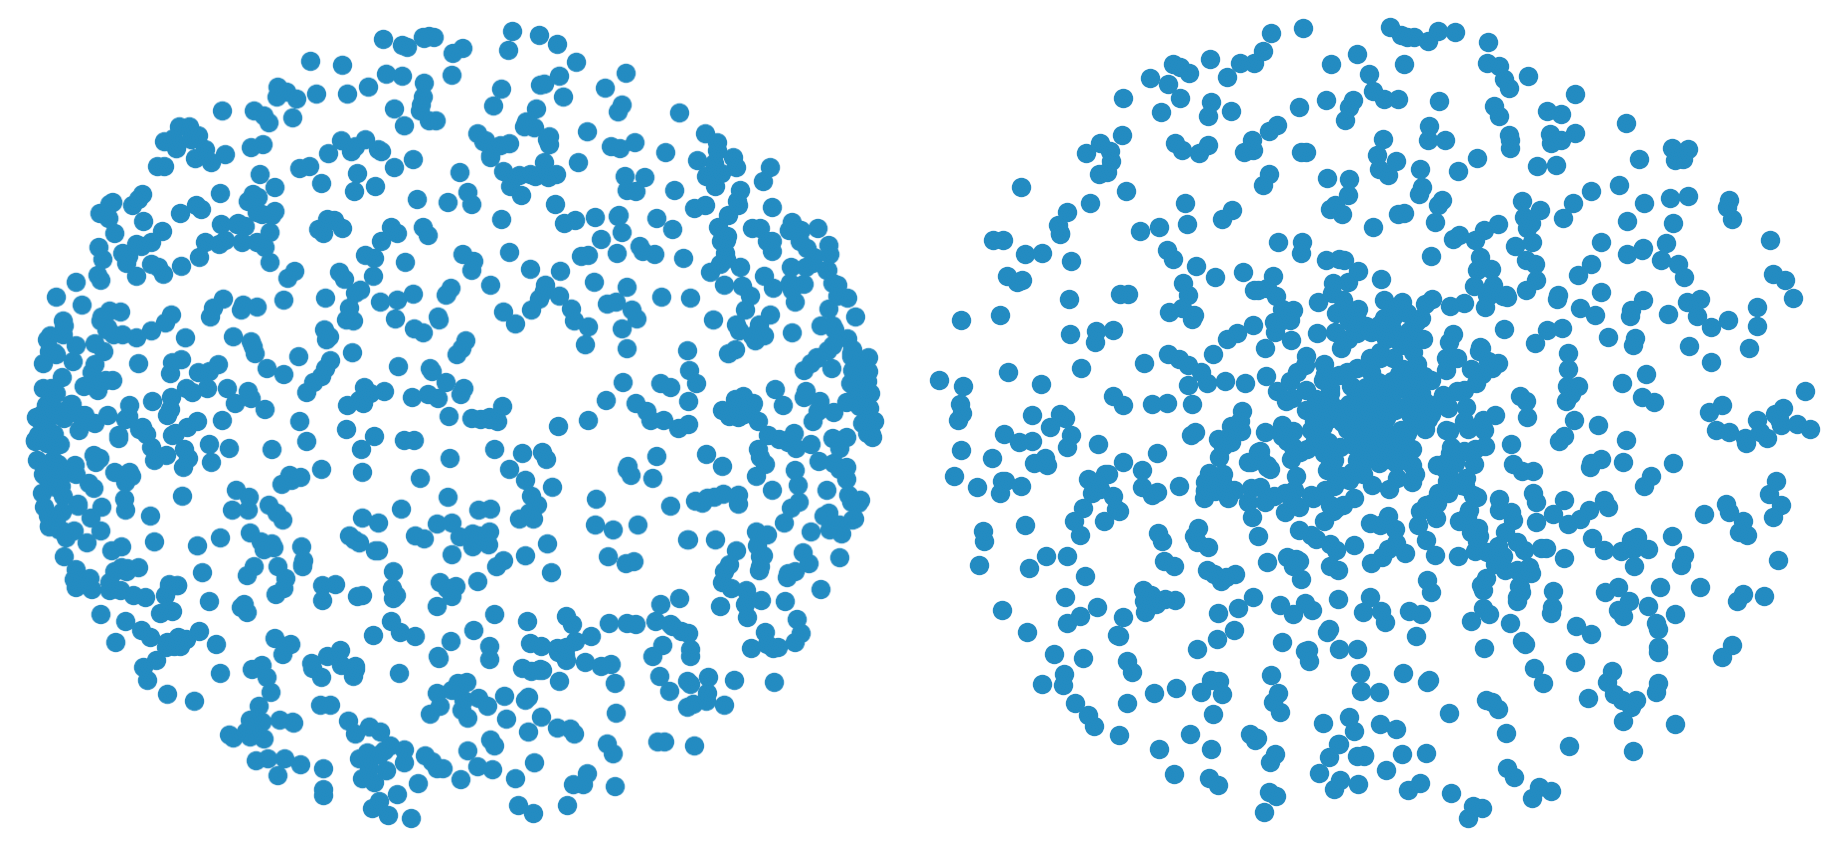
then y ~ U(-sqrt(R^2-x^2),sqrt(R^2-x^2)). The other method was sample θ ~ U(0,2π) then radius r ~ U(0,R). Both methods are incorrect, and looking at their respective plots quickly explains why.
While I was dumbfounded by my mistake, I learned some very elegant math as a consequence. Let’s take a look at how to actually generate uniform samples.
Explanation
I will go down the polar route because that is the most elegant method.
First, we need to ask the question, what does it mean to generate uniform points in a circle? You should agree that given a portion of a circle, there will be a constant ratio between the probability of generating a point in that portion and the area of the portion. Now that we have a key part of our problem defined, we need to figure out why the original method is wrong. From the picture and logically, there is nothing incorrect with how we sample θ. However, the way we sample the radius is producing an skewed distribution. To be certain, take a look at the following image.
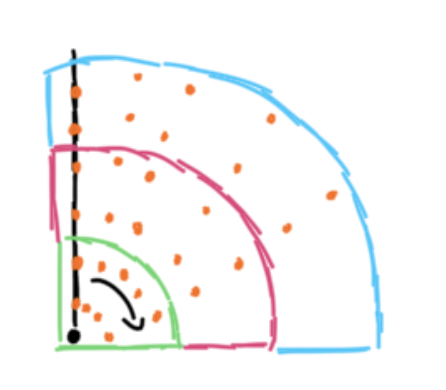
The orange dots represent uniform sampling along the radius, and as we sweep θ theta we can replicate the bad sampler’s behavoir. In the blue region, there are as many points as in the green, but their areas are not the same. Therefore as our radius increases, we need more points since the circle is getting bigger.
To convert our words into math, we need to look at cumulative distributions.
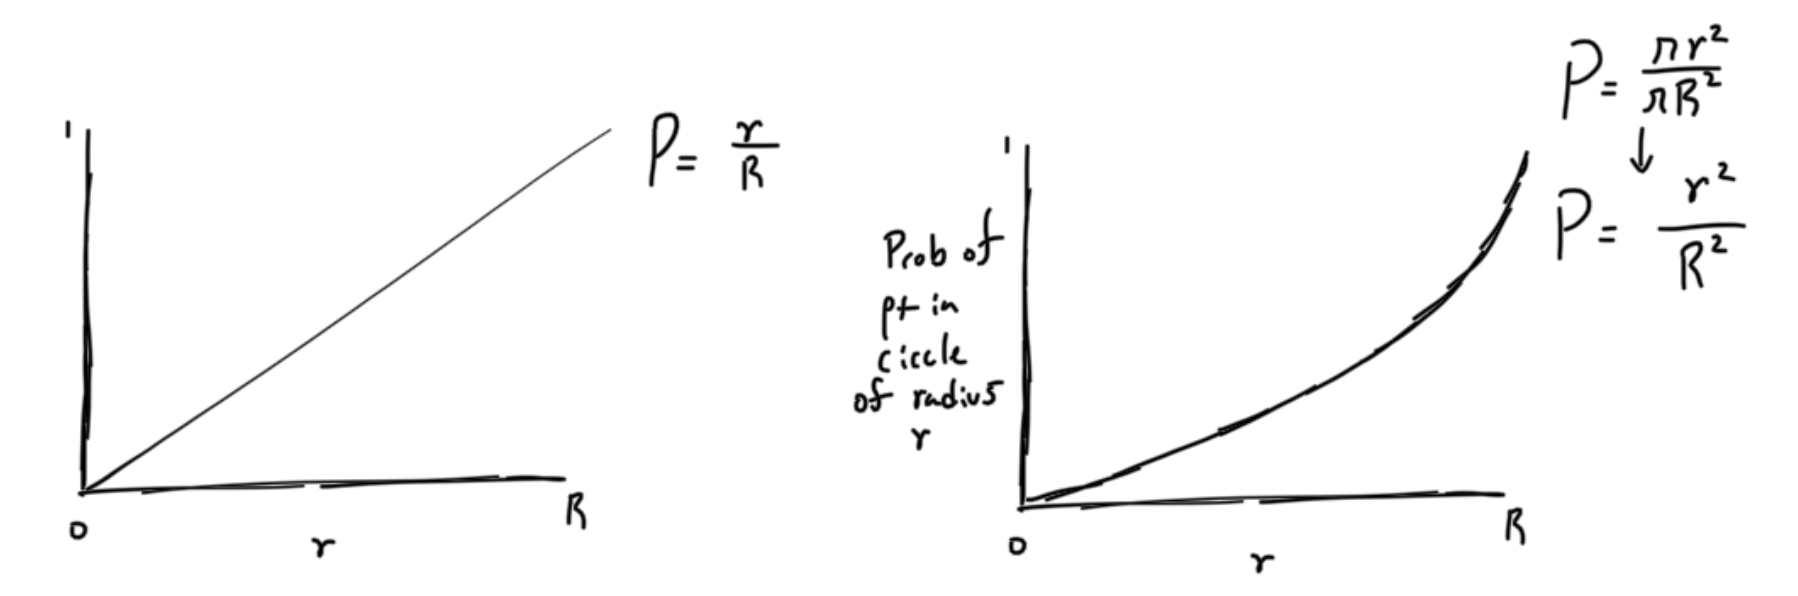
The graph on the left represents the CDF of our current sampler, r~U(0,R). The graph on the right represents what we want, which is the ratio of the area of the circle with radius r and the area of the outer circle with radius R.
Therefore we need some way of changing the sampled r such that it adheres to the CDF of the right graph.
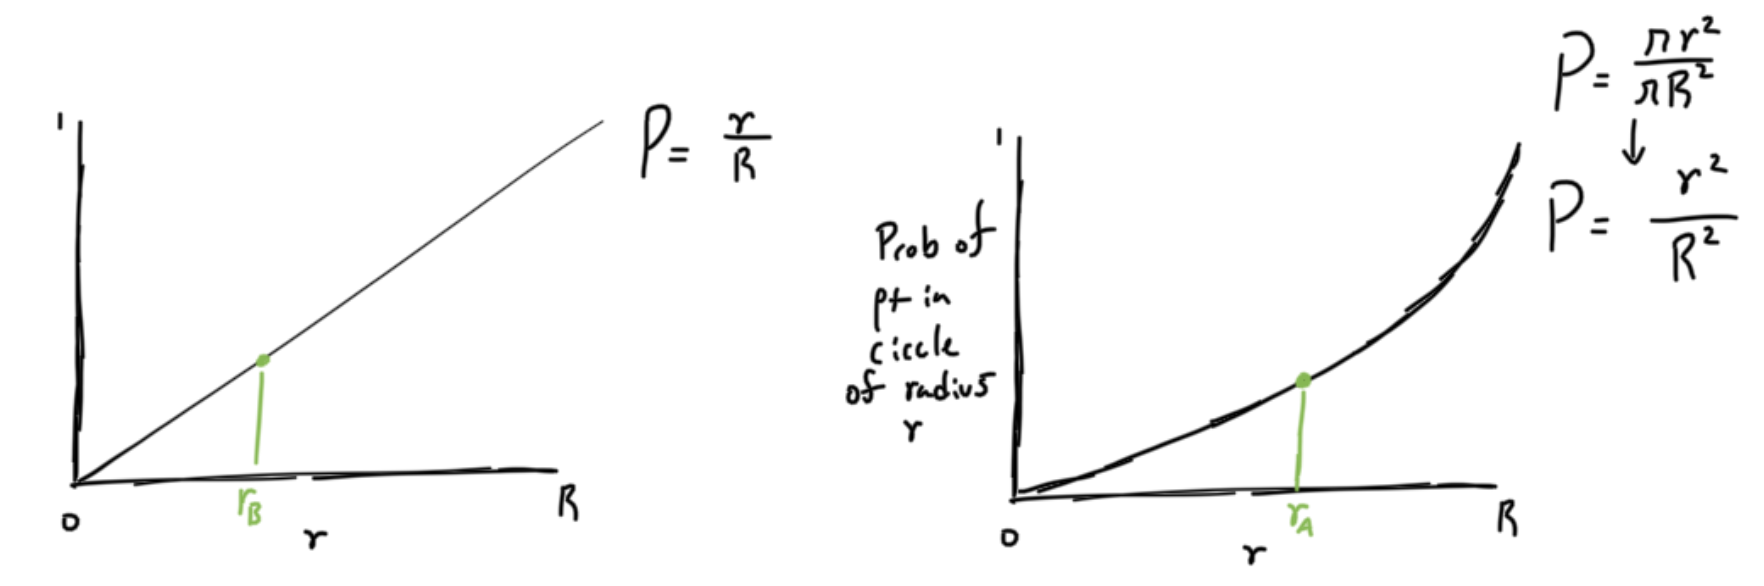
We can see that for any radius on the right graph, rA there exists rB that has the same CDF. And because both functions are monotonically increasing, we can posit the following statement:
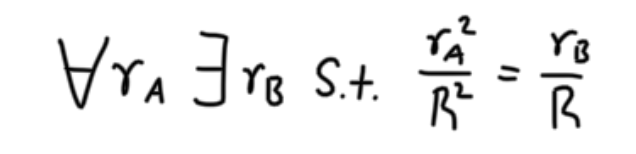
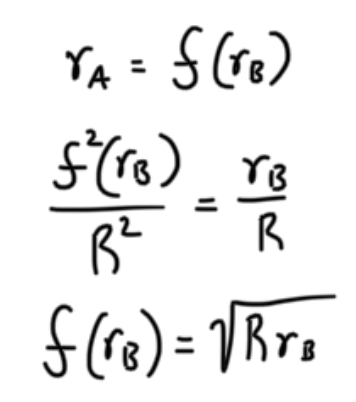
If you haven’t seen this notation before, the upside down A means “for all”, and the flipped E means “there exists”, and “s.t.” is an abreviation for “such that”. Furthermore, because both functions are monotonic, we can have a function, f, that maps rB → rA. Thus we obtain the following expression for the f(rB).
That’s it! To get an intuitive sense how what f means, take a look at the following graph.
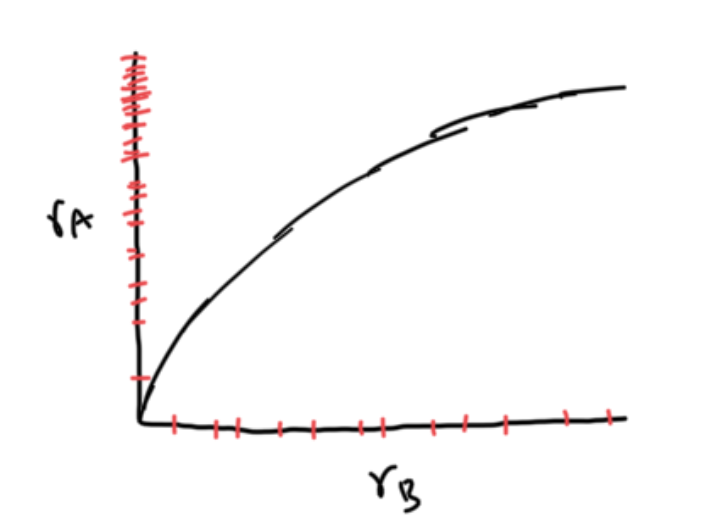
f pushes the uniform samples up so that they match the desired distribution.
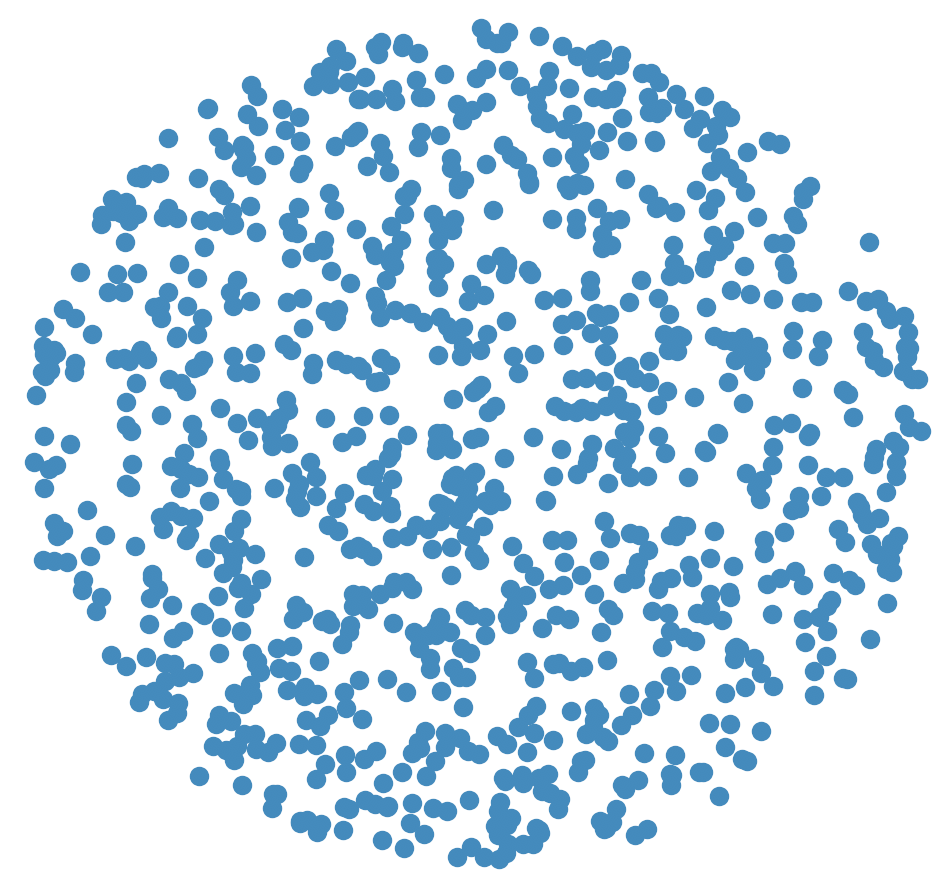
Using this method we obtain the following samples.
Code
import matplotlib.pyplot as plt
import math
import random

x = []
y = []
R = 10
for i in range(1000):
	theta = random.uniform(0,2*math.pi)
	r = random.uniform(0,R)
	x.append(math.sqrt(r*R)*math.cos(theta))
	y.append(math.sqrt(r*R)*math.sin(theta))

plt.scatter(x,y)
plt.show()